
This post contains affiliate links. We may earn a commission if you click on them and make a purchase. It’s at no extra cost to you and helps us run this site. Thanks for your support!
A social media report presentation template can transform your data. It turns raw numbers into a compelling visual story. Many people struggle to present social media analytics effectively. They often present lists of metrics without context or visual appeal. This approach fails to communicate the true impact of a social media strategy. What if your presentation could look as dynamic as the content you manage? This is where a strong design framework becomes essential.
This particular social media report presentation template for Adobe InDesign, created by Adobe Stock contributor E-Type, offers a powerful solution. It moves beyond generic charts and boring text. Instead, it provides a bold, engaging, and professional canvas. This allows you to showcase your social media performance with authority and style.
Please note that this professional graphic design template requires Adobe InDesign installed on your computer. Whether you use Mac or PC, the latest version is available on the Adobe Creative Cloud website—take a look here.
Why Your Social Media Report Deserves a Better Design
Visuals are not just about making things pretty. They are about making information understandable. A well-designed report helps your audience grasp complex data quickly. It highlights key insights and reinforces your strategic recommendations. Think about the last presentation you sat through. Which slides do you remember? Most likely, the ones that were visually striking and easy to understand.
This template uses a strong, modern aesthetic. The bold typography and a striking red, black, and white color palette demand attention. This is not a passive, background-style design. It is assertive and confident. Consequently, it reflects the kind of confidence you want to project when discussing your results. It’s designed for impact.

Deconstructing This InDesign Social Media Template
So, what exactly do you get with this social media report presentation template? It’s a comprehensive toolkit designed for professionals who need to communicate their social media efforts clearly.
Technical Specifications
The template is formatted to 1920 x 1080 pixels. This is the standard for high-definition screen presentations. Your slides will look sharp and professional on any modern display. It includes 12 unique, pre-designed pages. Each page is fully customizable within Adobe InDesign. This means you can easily tailor it to your brand and specific data needs. All the images and text are placeholders, allowing you to drag and drop your own content seamlessly.
Inside the Template: A Slide-by-Slide Look
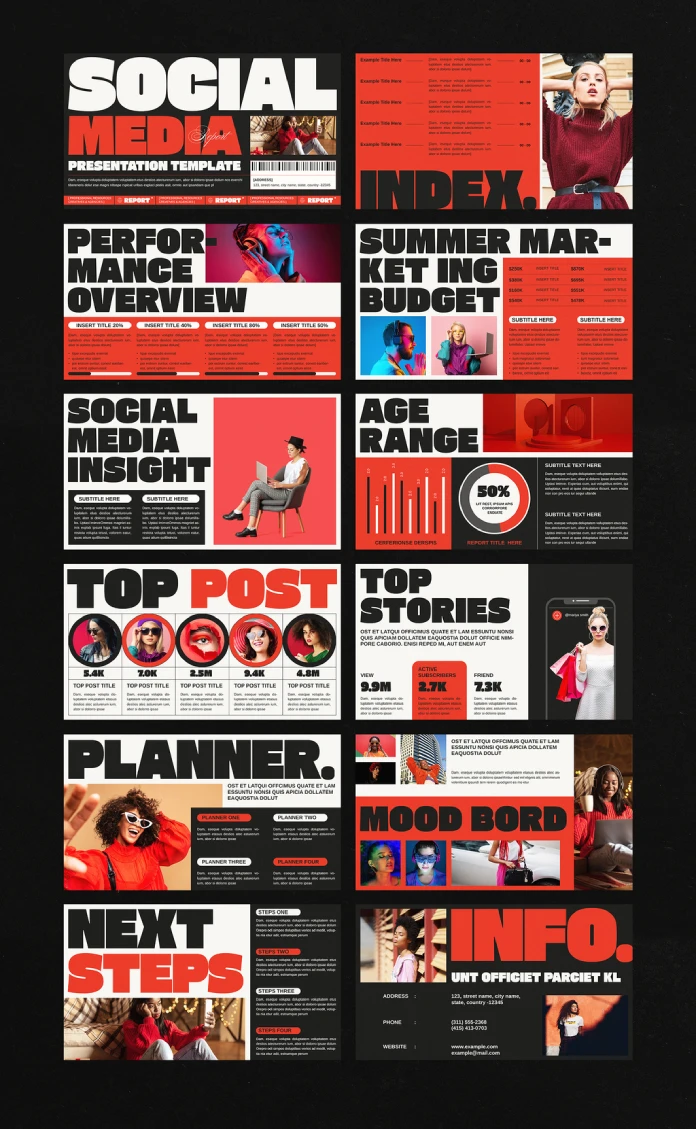
The 12 pages cover all the essential components of a thorough social media report. You will find dedicated layouts for:
- Title and Introduction: Make a strong first impression.
- Performance Overview: Present key metrics in a visually digestible format.
- Social Media Insight: Go deeper into audience analysis and engagement.
- Top Posts and Stories: Showcase your most successful content with visual proof.
- Budget and Planning: Clearly outline financial aspects and future strategies.
- Mood Board and Next Steps: Communicate your creative vision and actionable plans.
This structure provides a logical flow for your narrative. It guides your audience from high-level performance down to the granular details of your future strategy.
How to Present Social Media Data Effectively with this Template
Using this social media report presentation template is straightforward. However, its effectiveness depends on how you populate it. The design provides the framework. You provide the substance.
First, gather all your data. This includes key performance indicators (KPIs), audience demographics, top-performing content, and campaign results. Next, match your data to the corresponding slides. For instance, the “Performance Overview” is perfect for your reach, engagement, and conversion rates. The “Top Post” section is where you’ll insert screenshots of your most successful content.
Then, customize the design elements. While the existing color scheme is powerful, you can easily adjust it to match your own brand guidelines in Adobe InDesign. Change the fonts, update the color swatches, and insert your logo. This customization makes the report uniquely yours. It reinforces brand consistency across all your communications.
A Design Critic’s Perspective
From a design standpoint, this template is exceptionally well-crafted. The use of bold, condensed sans-serif typography creates a strong visual hierarchy. Your eyes are immediately drawn to the most important information. The grid-based layout ensures that every element is perfectly aligned. This creates a sense of order and professionalism.
The designer, E-Type, has skillfully balanced text, imagery, and negative space. The slides never feel cluttered. Even data-heavy sections, like the “Age Range” chart, are presented cleanly. This minimalist approach allows your content to be the hero. What I find particularly compelling is the blend of a modern, almost brutalist, typographic style with clean corporate presentation formats. It’s a fresh take in a world of generic templates. It communicates that your social media presence is not just another marketing channel; it’s a core part of a modern, forward-thinking brand.
Ultimately, this social media report presentation template is more than just a set of slides. It is a tool for communication. It empowers you to present your social media results with clarity, confidence, and visual impact. It helps you tell a story that resonates with your audience, whether they are your internal team, management, or clients. By investing in a professional presentation design, you elevate the perception of your work. You show that you are not just reporting numbers; you are driving meaningful results.
Check out more design templates on WE AND THE COLOR.
Subscribe to our newsletter!


