
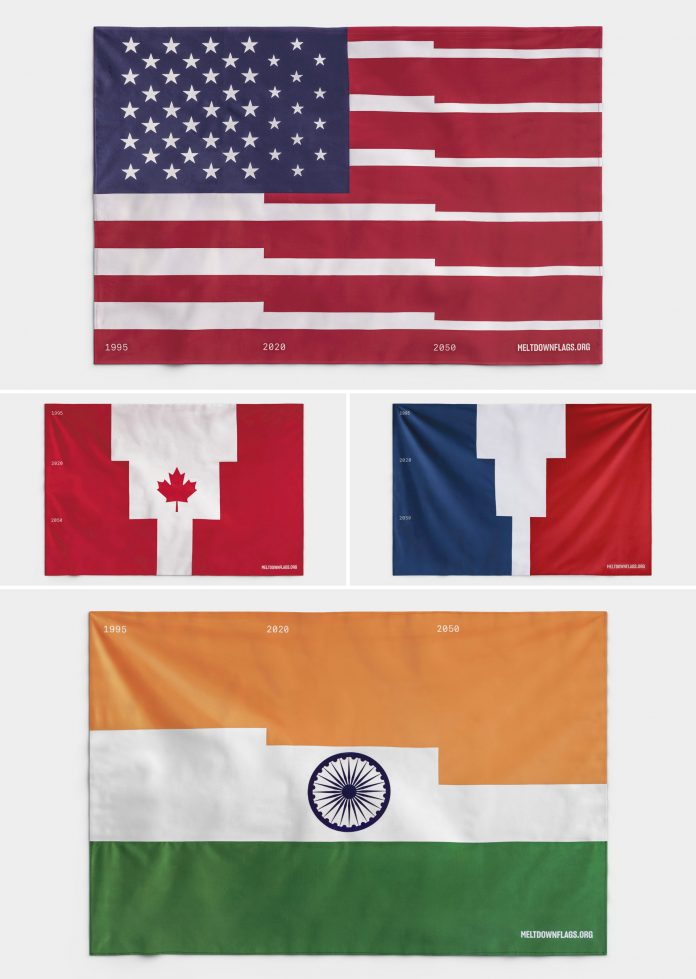
Meltdown Flags, a climate data initiative that visualizes the effects of global glacier retreat.
Global warming is taking a heavy toll on the world’s glaciers. Holding 69% of the world’s drinking water—glaciers are life.
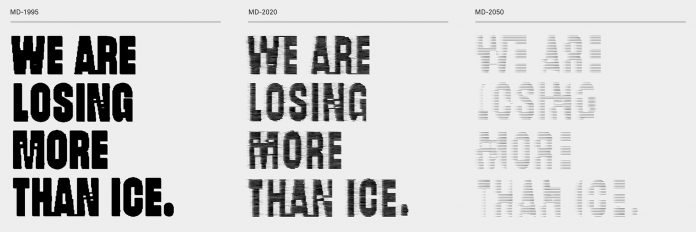
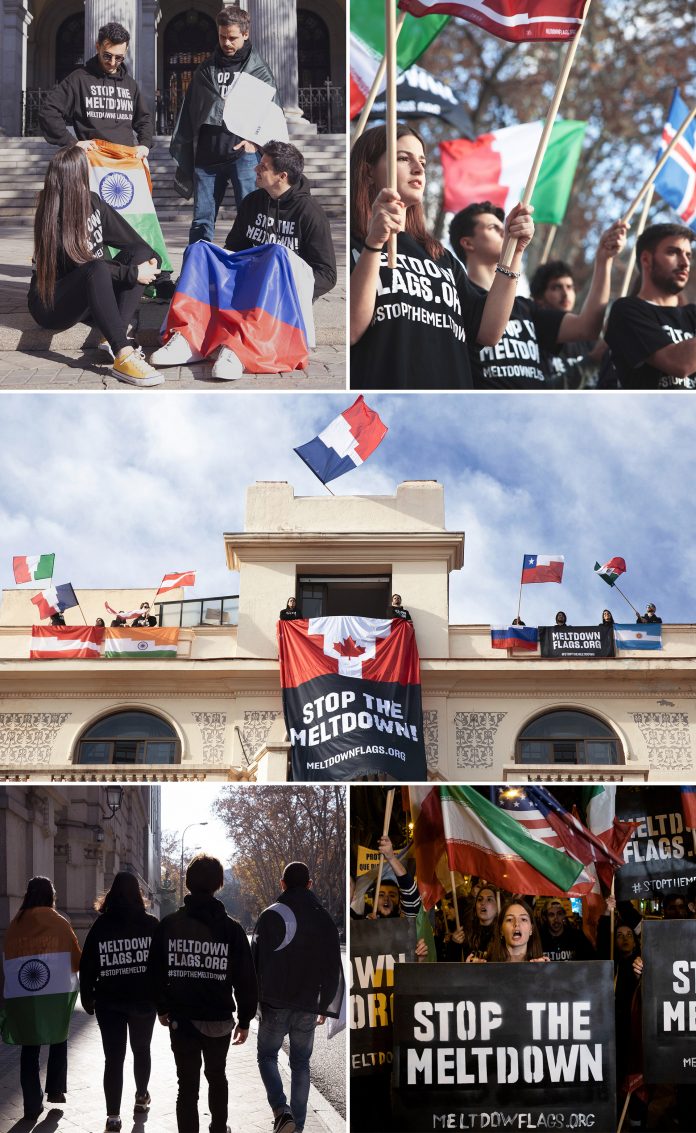
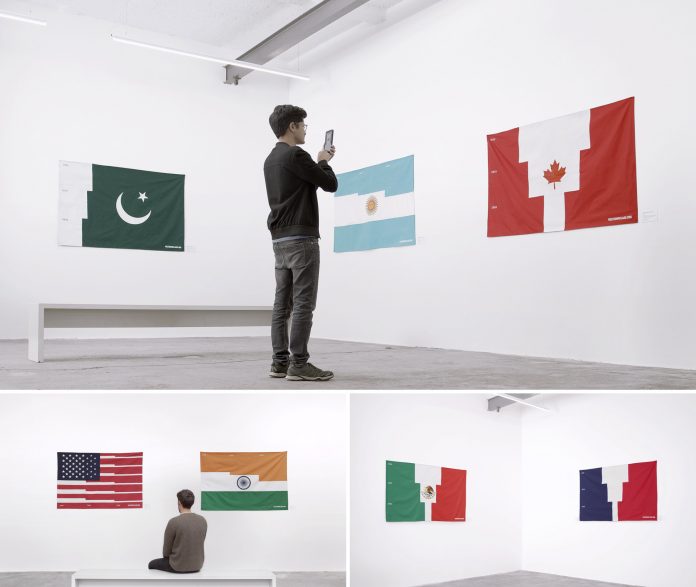
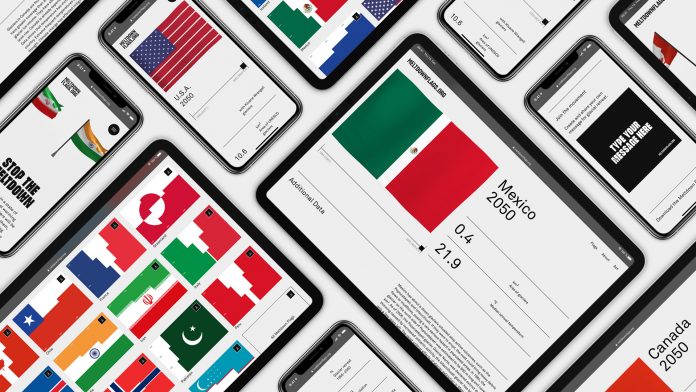
To bring this to people’s attention, in collaboration with Serviceplan and METER Group, German graphic design studio Moby Digg created Meltdown Flags, a climate data initiative that visualizes the effects of global glacier retreat by reducing the amount of white in the flags of countries with glaciers. We show the past, present and future states of the meltdown.
You can see the project live at meltdownflags.org or show your support by following Meltdown Flags on Instagram.

All images by graphic design studio Moby Digg. Check out other inspiring work in our Graphic Design category.
Subscribe to our newsletter!


