

This post contains affiliate links. We may earn a commission if you click on them and make a purchase. It’s at no extra cost to you and helps us run this site. Thanks for your support!
Take your business presentations to the next level with GraphyPix’s stunning set of infographic templates.
As creative professionals, we understand the importance of delivering information in a visually engaging and easily digestible manner. This is where high-quality infographics come into play, transforming complex data into captivating visual stories. For those using Adobe InDesign, a new set of business data visualization infographics by Adobe Stock contributor GraphyPix is set to revolutionize your presentation game.

Please note that this template requires Adobe InDesign. You can get the latest version from the Adobe Creative Cloud website—just take a look here.

A Closer Look at the Infographic Set
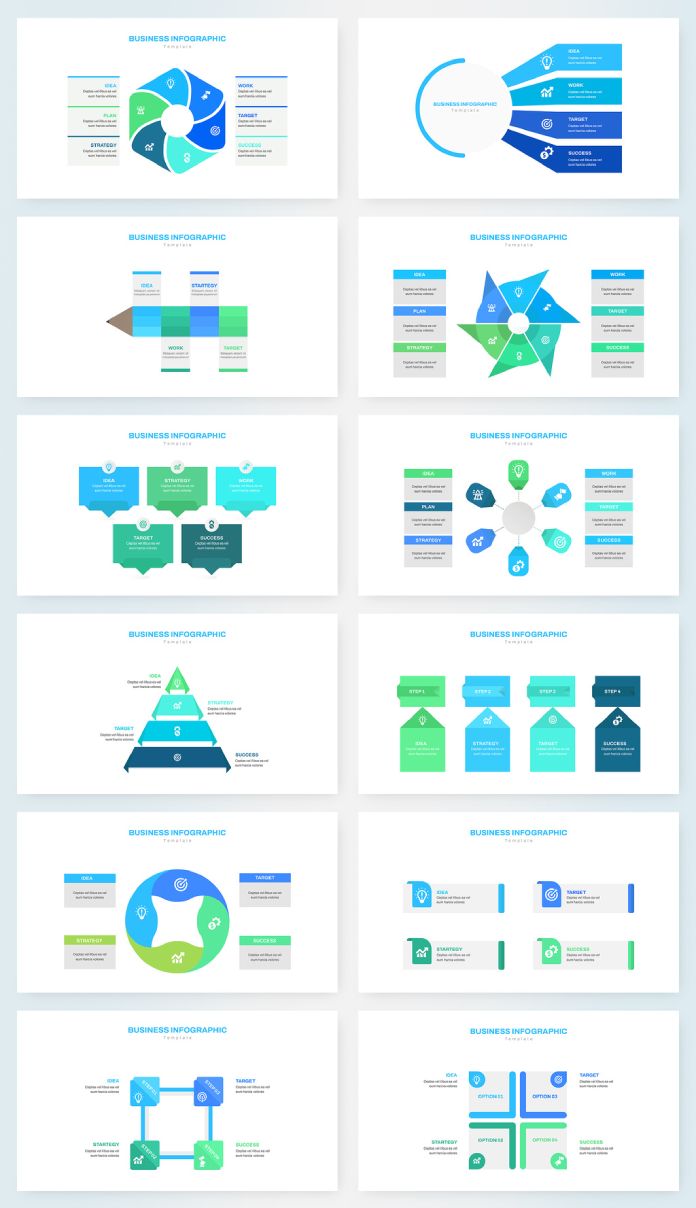
This meticulously designed set consists of 12 infographic pages, each measuring 1920 x 1080 pixels. This aspect ratio is perfect for screen presentations, ensuring that your visuals are crisp and clear on any display. The infographics cover a wide range of business topics, making them versatile tools for any professional setting.
Here are some standout features of this infographic set:
- Diverse Layouts: The set includes a variety of layouts, from circular diagrams to pyramid charts, each crafted to present information in a unique and engaging way. Whether you’re explaining a business strategy, showcasing project milestones, or breaking down complex processes, there’s a layout tailored to your needs.
- Customizable Elements: One of the key benefits of these templates is their full customizability. Every element within the infographics can be tailored to fit your brand’s aesthetic. Change colors, adjust text, and modify shapes to create a cohesive visual identity that resonates with your audience.
- Professional Design: Each infographic page is designed with professionalism in mind. The clean lines, balanced colors, and strategic use of icons not only enhance the visual appeal but also ensure that the data is communicated effectively.
- Easy to Use: For Adobe InDesign users, these templates are a breeze to work with. The intuitive design allows for quick adjustments, so you can spend more time focusing on content rather than getting bogged down by design intricacies.
Applications in Business Presentations
These infographics are particularly well-suited for a variety of business applications, including:
- Strategy Presentations: Illustrate your strategic plans with clear, compelling visuals. Use the pyramid and flowchart templates to show the hierarchy of steps or the flow of processes.
- Performance Reports: Highlight key metrics and performance indicators. The circular and bar chart designs are perfect for showing progress and comparing data points.
- Project Updates: Keep stakeholders informed with engaging project timelines and milestones. The arrow and process templates can help depict the stages of project development clearly.
Why Choose GraphyPix’s Infographics?
GraphyPix has established a reputation for creating high-quality, user-friendly design assets, and this infographic set is no exception. By incorporating these templates into your presentations, you not only enhance the aesthetic appeal but also improve the clarity and impact of your message.
Moreover, using professionally designed templates can save you significant time and effort, allowing you to focus on the content and delivery of your presentation.
GraphyPix’s business data visualization infographic set for Adobe InDesign offers a powerful tool to achieve this, providing you with the flexibility to create stunning, professional presentations with ease.
Whether you’re a seasoned graphic designer or a business professional looking to elevate your presentation skills, this infographic set is a valuable addition to your toolkit. Embrace the power of visual storytelling and make your data shine with GraphyPix’s expertly crafted templates.
Feel free to find other recommended graphic design templates for different creative needs on WE AND THE COLOR.


